Canvas New Analytics
New Analytics is a feature within Canvas which provides improved analytics for tracking student data using an interactive chart or table. This feature allows instructors and TAs to gain a stronger understanding of student performance in order to help enhance student success.
Open Course
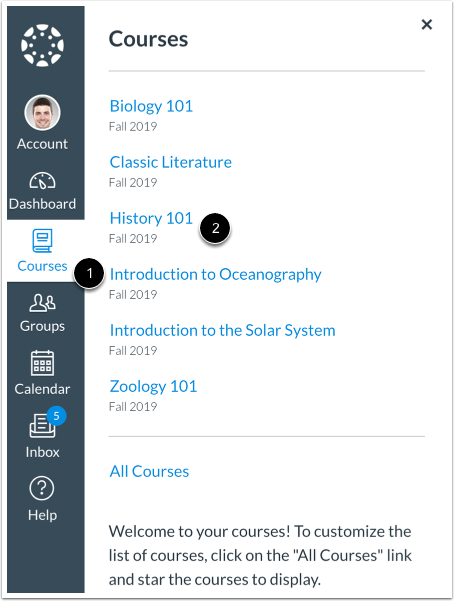
In Global Navigation, click the Courses link [1], then click the name of the course [2].
Open New Analytics
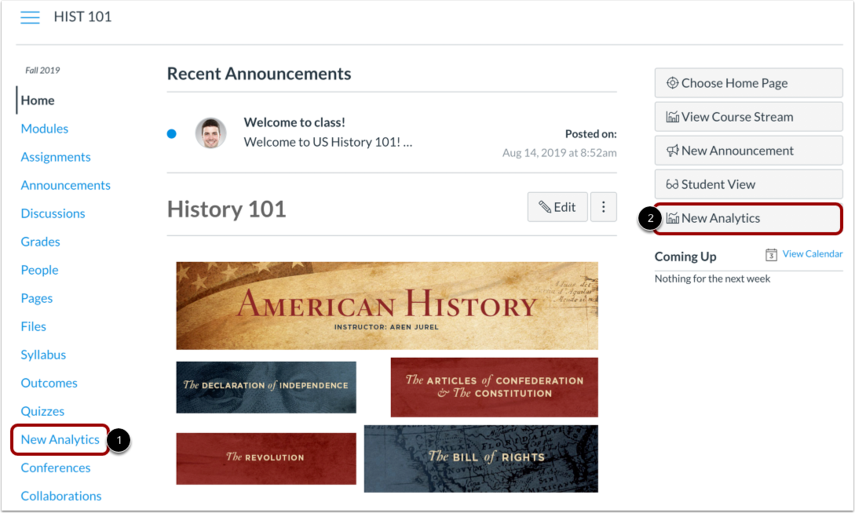
To open New Analytics, click the New Analytics link in Course Navigation [1] or click the New Analytics button in the Course Home Page [2].
Open Course Grade Analytics
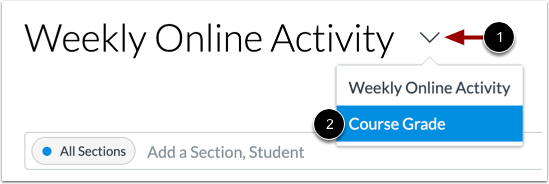
To view course grade analytics, click the Analytics drop-down menu [1] and select the Course Grade option [2].
View Data Status
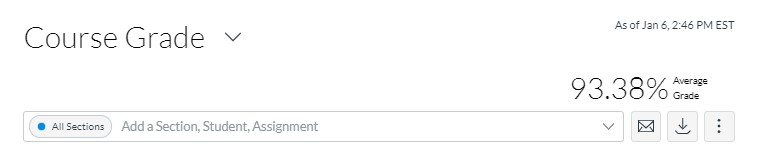
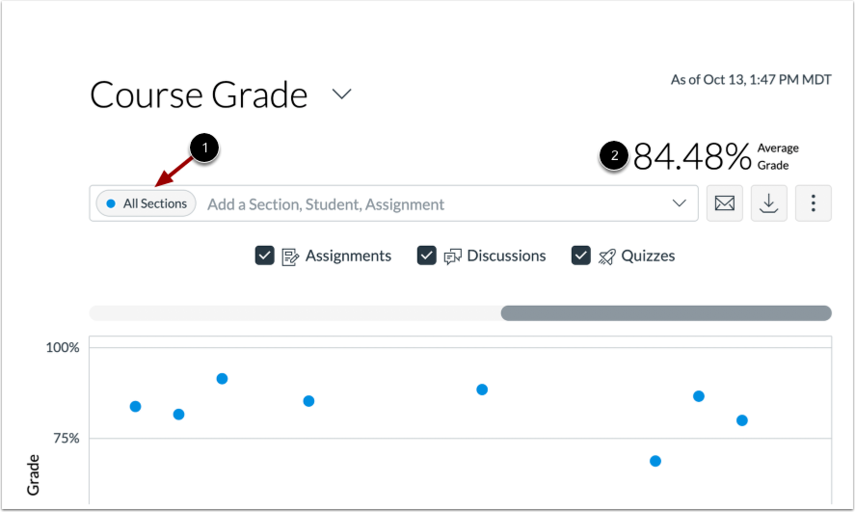
For reporting accuracy, the page displays the last time analytics data was last updated. Data is refreshed in New Analytics every 24 hours.
In this example, analytics data was last updated Jan 6 at 2:46 PM EST.
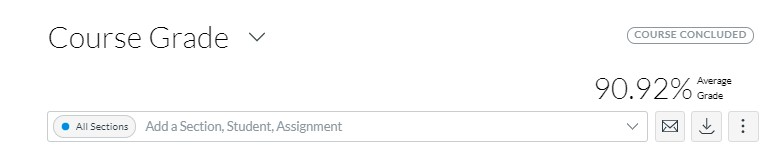
Note: If the course has been concluded, a Concluded label replaces the Data Last Updated date/time.
View Filter
The analytics page is dynamic based on filtered content. By default, all results display the course average, which cannot be removed [1].
You can also view the average grade percentage for all students [2], which is not affected by any filter.
Filter By Assignment
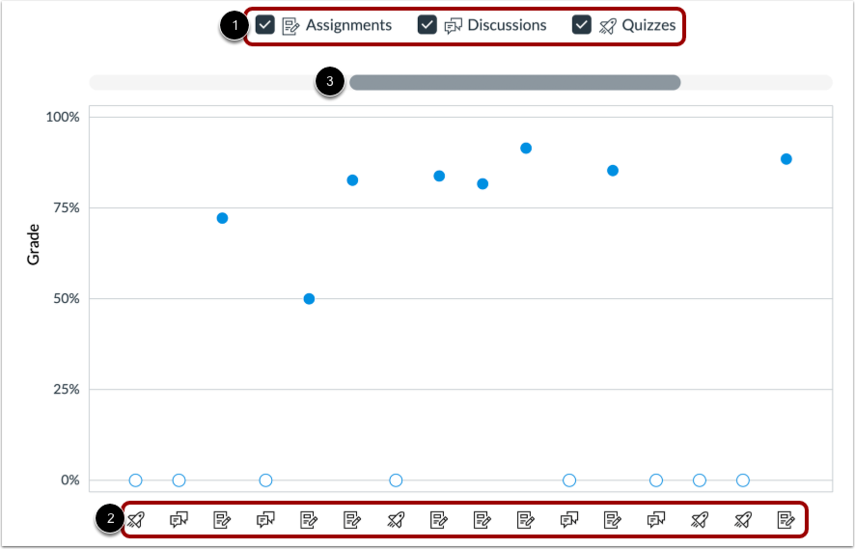
By default, analytics selects all assignment types to display within the page [1]. Each assignment in the chart displays the appropriate icon for each visible assignment type [2]. To view additional assignments, click and drag the scrollbar [3].
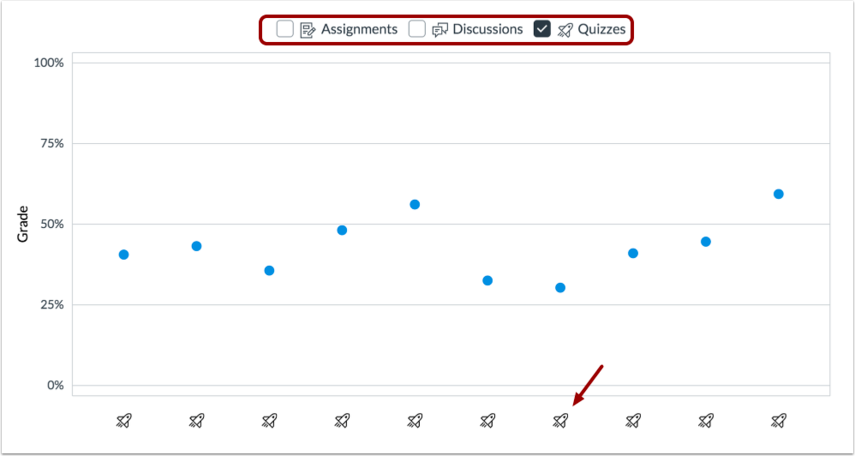
To filter by assignment type, remove the checkbox next to the assignment type. The chart dynamically updates the results based on the assignment type selected or removed in the filter. For example, you can view only Assignments, only Quizzes, or only Discussions – or any combination of these assignment types.
The chart dynamically updates the results based on the assignment type that you select or remove using the filter.
Note: At least one assignment type is required at all times.
Card Data Details
You can view details about an assignment by clicking any data graph point or data table percentage. Detailed metrics for the assignment will display in a summary card, including the
- assignment name
- due date and time
- average grade for the assignment
- low and high grades by percentage
- number of missing and late submissions, and
- grade distribution for this assignment.
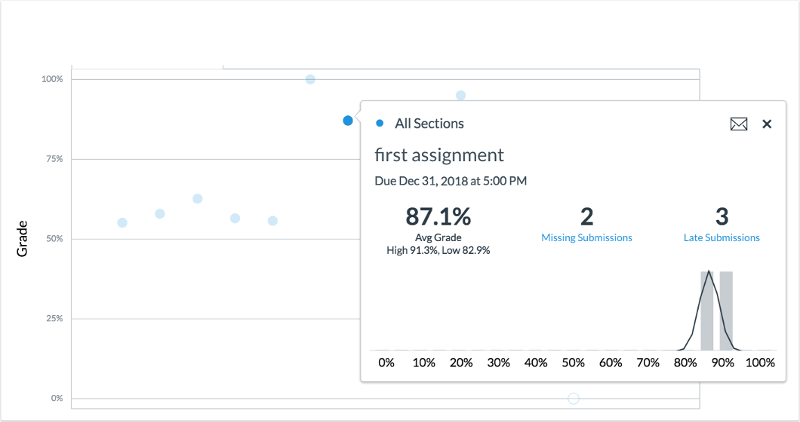
Instructors can also send a message to all students who are within a specific score range or who have missing or late assignments.
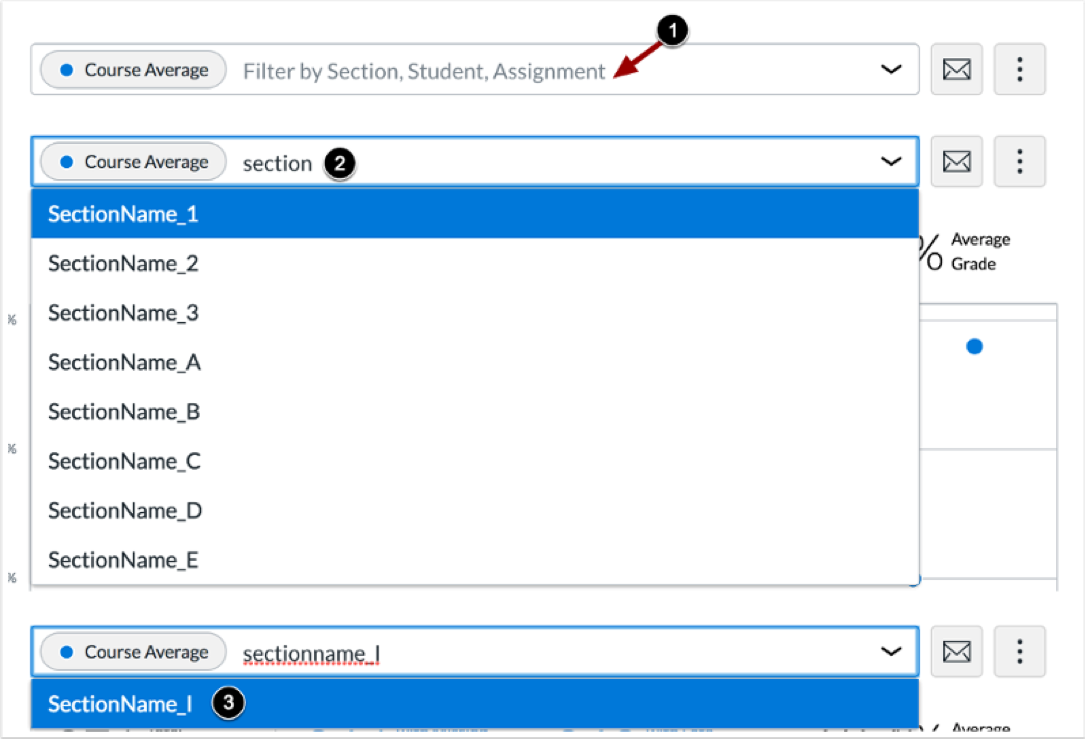
Comparison Filters
Instructors can filter analytics results [1] to compare the average course grade with a specific section [2], student, or assignment.
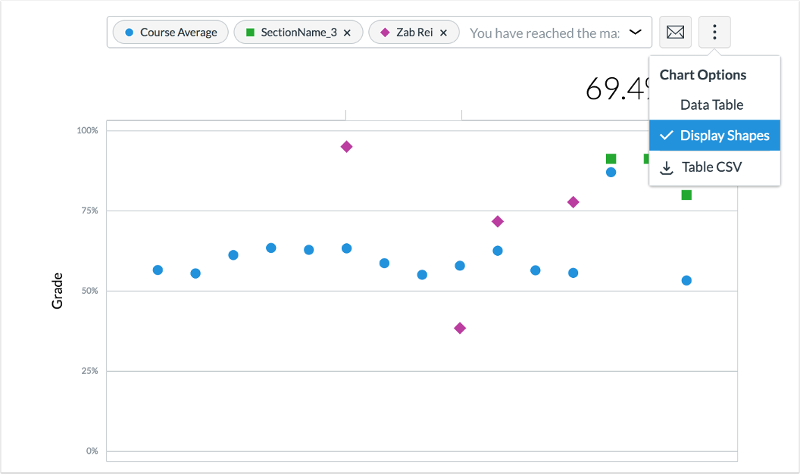
You can also view detailed metrics for an assignment, student, or section and display these in a summary card.
Each filter displays as a different color in the chart. You can also display each filter with a different shape for additional contrast.
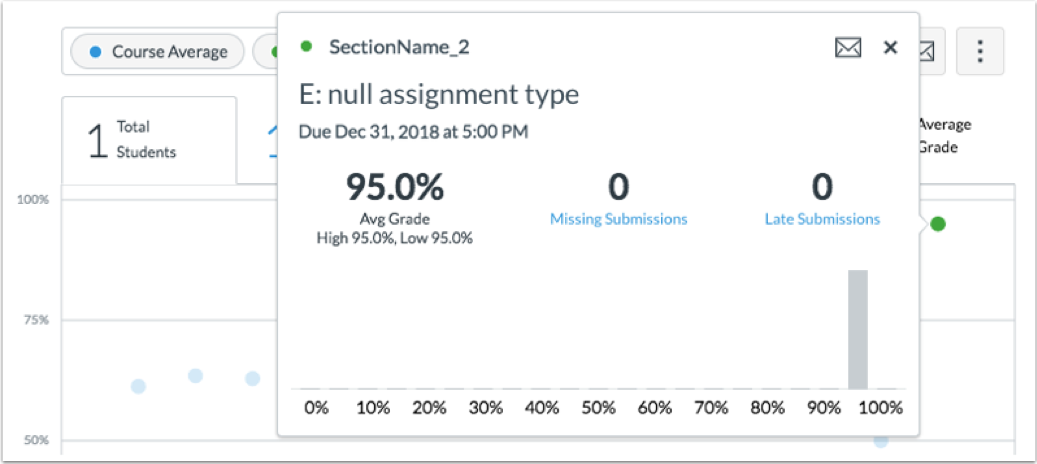
Section Card Details
In an assignment comparison with a section, details provide additional metrics for the
- section name
- assignment name
- assignment due date
- average grade for the assignment
- low and high grades by percentage, and
- number of missing and late submissions.
The percentage bar includes a tooltip that displays the number of students who achieved the average grade.
Instructors can also send a message to students with missing and late submissions directly from the section metrics card.
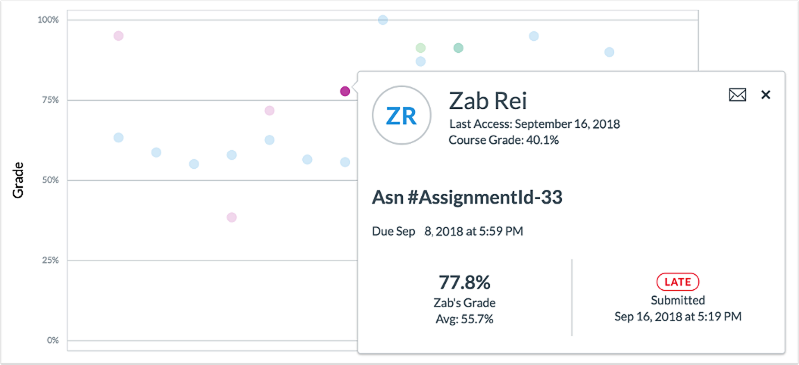
Student Card Details
In an assignment comparison with a student, details provide additional metrics for the
- student’s full name
- last access date
- overall course grade percentage
- assignment name and due date
- the student’s grade for the assignment, and
- the status of the assignment and submission date.
Instructors can also send a message directly from the student metrics card.
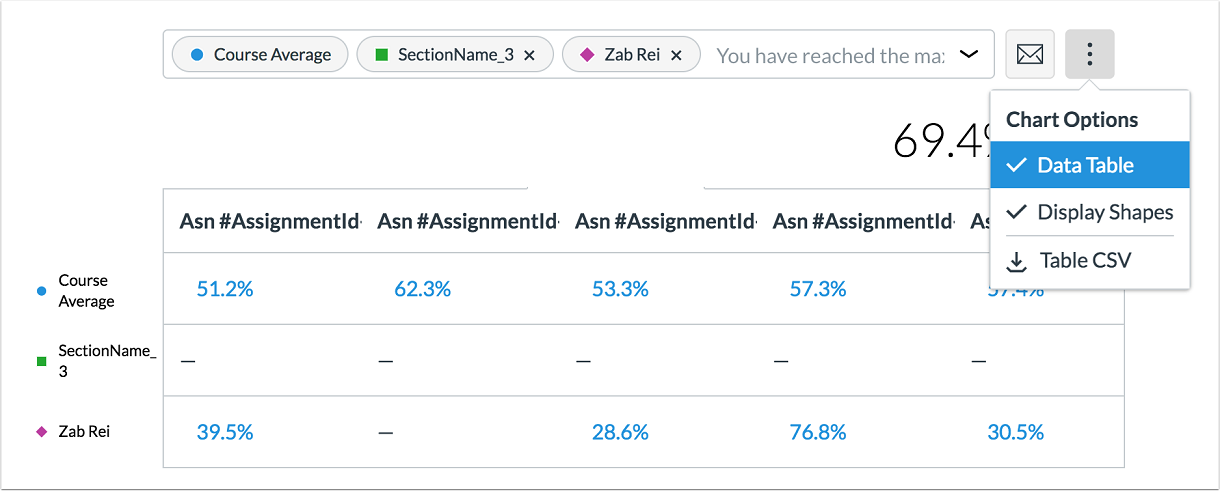
Data Table
Data can also be viewed as a data table by percentage instead of a chart by clicking the Data Table option within the Chart Options menu.
Detail can be viewed for any data point by clicking the percentage link.
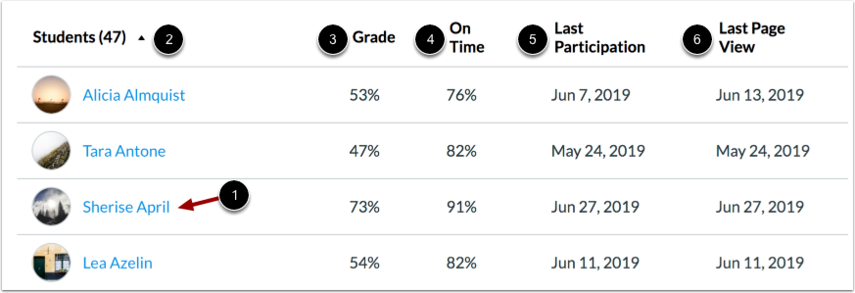
Student Table
For each student, the student table displays the
- student name [2],
- current grade [3],
- percentage of assignments submitted on or before the due date [4],
- date of last participation [5], and
- date of last page view [6]
The student table is ordered alphabetically by last name. Any column can be sorted by clicking the column header. An arrow next to the header names indicates which column is sorting the content.
Message Students Who
Instructors can send messages to students whose grades or submissions are within specific criteria.
Message recipients are automatically populated based on selected criteria as well as any applied filters.
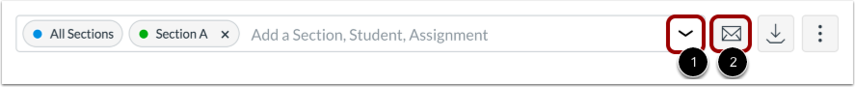
If you want to filter analytics for a specific assignment, section, or student, search for and select the intended filter in the Filter field [1]. Then click the Message icon [2].
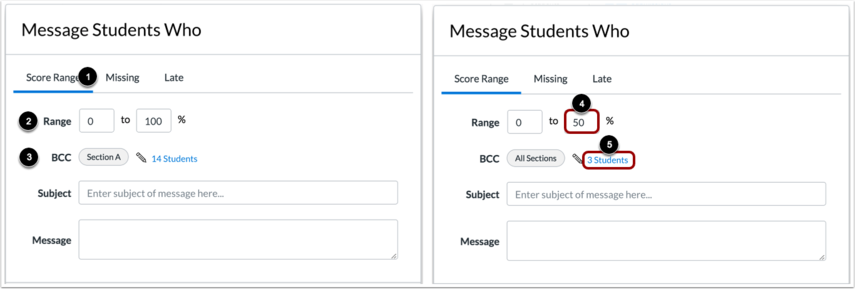
The Message Students Who window defaults to the Score Range criterion [1], which allows you to message students based on a specific current grade percentage range in the course.
The Range field determines the specified percentage range [2], and the BCC field displays the number of students who fall within the specified range [3]. By default, the Range field displays 0 to 100%, so the BCC field includes all students in the course. Additionally, any filters in the analytics page automatically display as an intended recipient for the message. If no filters have been applied, the message displays as being sent to all sections.
To select a new range, enter the minimum and maximum current grade percentage in the percentage fields [4]. The BCC field displays the updated number of students and/or sections who have grade percentages within the specified range [5].
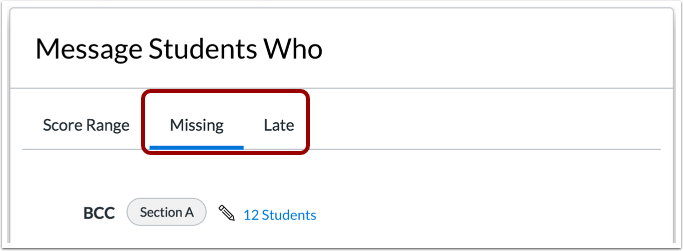
The Missing and Late criteria options do not include any additional criteria. Selected students are based on submission status, and the number of affected students displays in the BCC field. Again, any filters included in the analytics page also display as intended recipients.
Verify Recipients
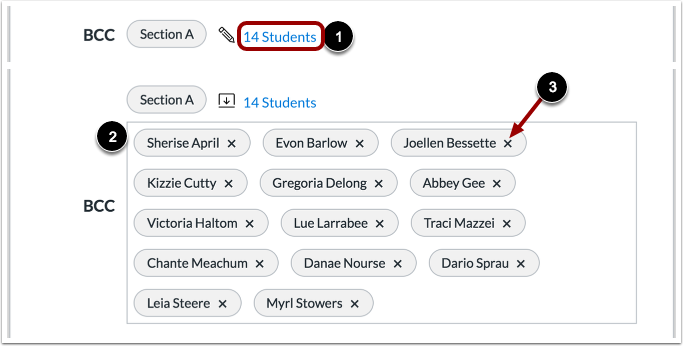
For any criterion, you can manage the users who will be sent the message, if needed. Click the link that includes the number of students [1], then view the expanded BCC field [2].
To remove a student from the message, click the student's Remove icon [3].
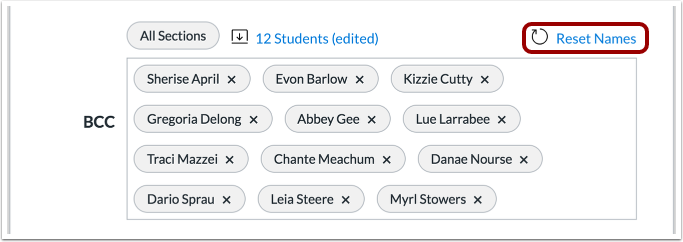
To reset student names back to the originally specified list, click the Reset Names link.
Send Message
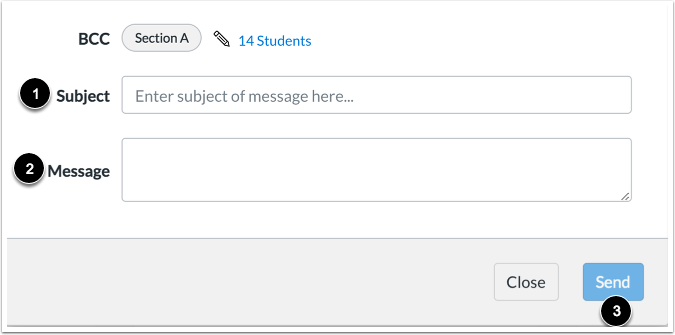
In the Subject field [1], enter a subject for your message.
In the Message field [2], enter the description of your message.
Click the Send button [3].
Export Table CSV
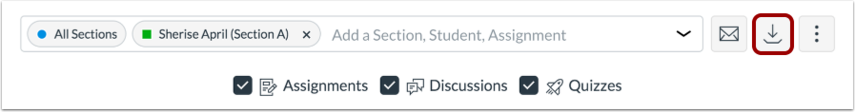
To export analytics data as a CSV file, click the Download button.
CSV data is exported according to the filtered data.
CSV files display the
- student's full name
- sortable name
- Canvas user ID
- SIS user ID or email (if applicable)
- overall course grade
- the percent that assignments have been on time
- the last page view time
- the last participation time, and
- last time the student logged out
Experiencing an issue or need additional support? Contact our OneIT Team by